2 GB per file. Processed entirely in memory on your machine.
Step 2Frame Extraction
FFmpeg splits the video into individual PNG frames at the configured interval. Duration is also read via ffprobe.
video file
→
ffmpeg -vf fps=N
→
frame_00001.png
frame_00002.png
...
Interval
Configurable from 0.25s to 30s. Default: 1 frame/second. Lower = more data points, slower processing.
Region Crop
Each frame is cropped to the region you selected in the preview. Only the cropped area is sent to OCR.
Step 3OCR Number Recognition
Each cropped frame is processed by the OCR engine to extract the displayed number. You can choose which engine to use from the settings panel before starting the analysis.
Apple Vision
Native macOS framework at accurate recognition level. Handles colored text, low contrast, and variable backgrounds natively. macOS only — not available in Docker or Linux.
EasyOCR
PyTorch-based deep learning OCR. Runs on CPU with high accuracy across fonts, sizes, and backgrounds. Available on all platforms including Docker.
Dual Mode
On macOS, select Dual to run both engines on every frame. The dashboard shows the concordance rate — the percentage of frames where both engines agree.
Docker
In Docker, only EasyOCR is available. Apple Vision and Dual mode appear greyed out with "not compatible" in the engine selector.
cropped frame
→
Engine Selector
→
detected number
Step 4Temporal Coherence
After OCR, a two-pass algorithm cleans the data to produce smoother, more reliable curves.
Pass 1 — Gap Filling
Missing values (frames with no detection) are filled by linear interpolation from the nearest valid neighbors within a 2-frame window.
Example: if frame 5 = 29, frame 6 = missing, frame 7 = 31, then frame 6 is filled with 30.
Pass 2 — Outlier Correction
Each value is compared against the median of its ±2 neighbors. If it deviates by more than 3× the local MAD (median absolute deviation), it is replaced with the median.
Example: neighbors are [29, 30, 31, 30] but this frame says 85 → corrected to 30.
Raw OCR
→
Fill Gaps
→
Fix Outliers
→
Clean Data
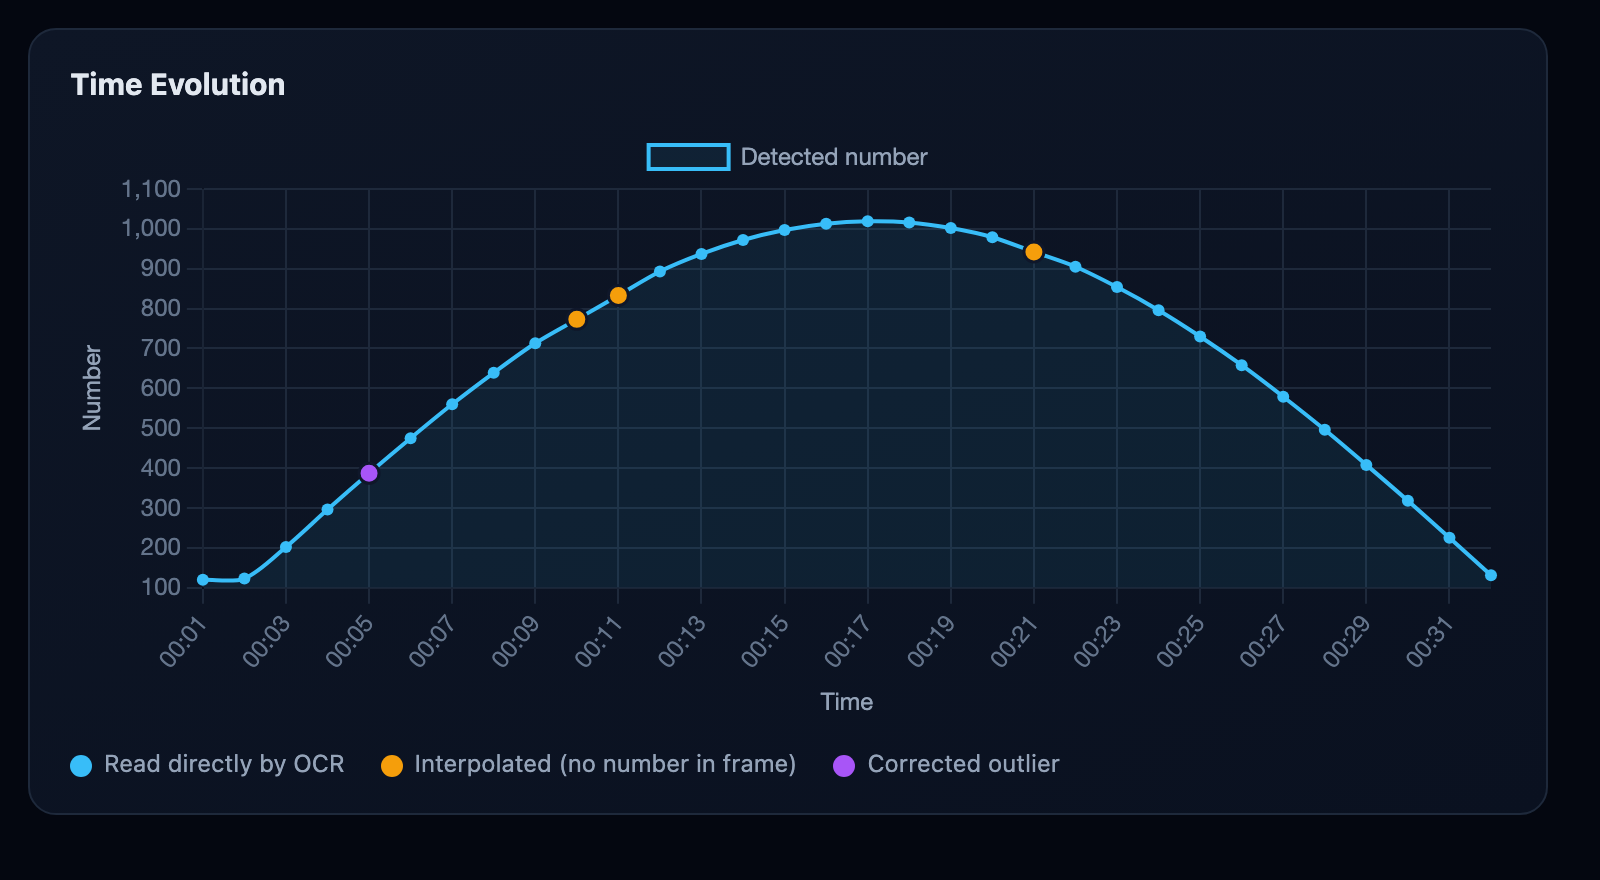
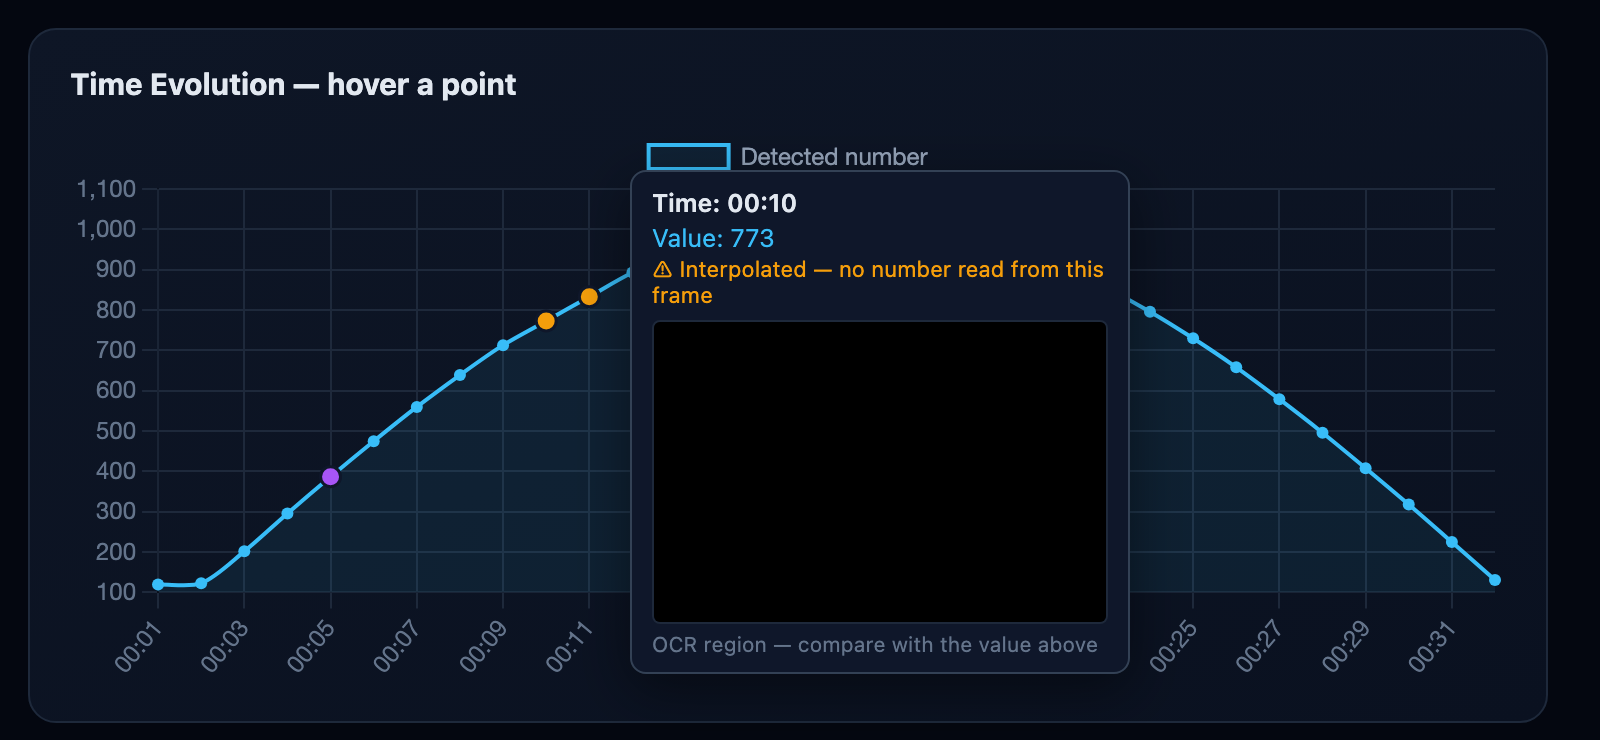
Real output. Each point is colour-coded by how its value was obtained: blue = read directly by OCR, amber = interpolated gap, purple = corrected outlier.
Step 5Dashboard & Visualization
The cleaned dataset is sent back to the browser and rendered into an interactive dashboard with Chart.js.
Time Evolution
Full emission curve with zoom, pan, and time range selection. Customizable presets (first 30s, last 30s, etc.).
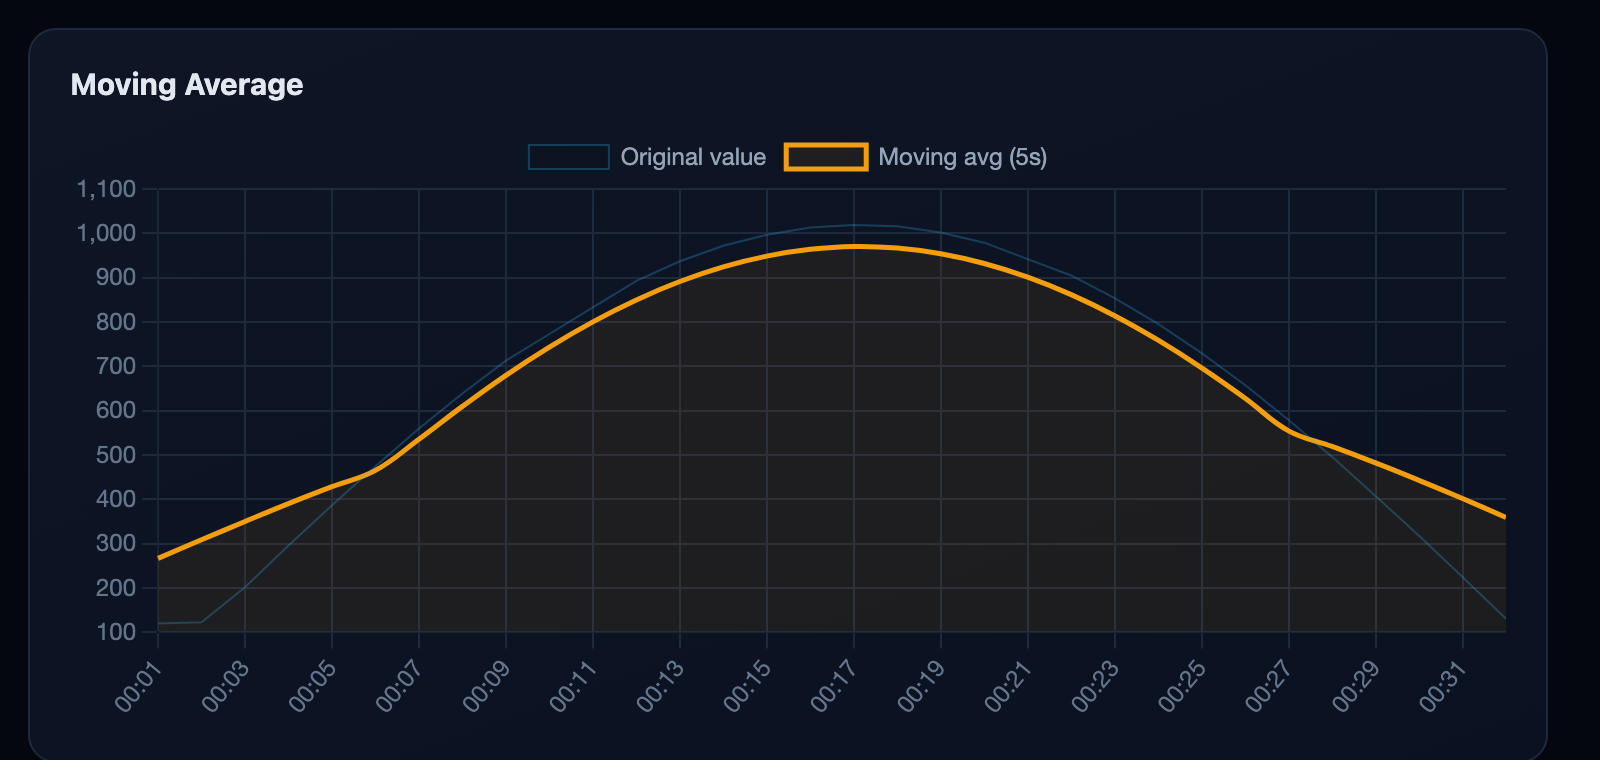
Moving Average
Smoothed trend line with adjustable window (3s–30s). Shows the overall fluorescence trajectory.
Min, max, average, total change, detection rate. All computed from the post-processed clean dataset.
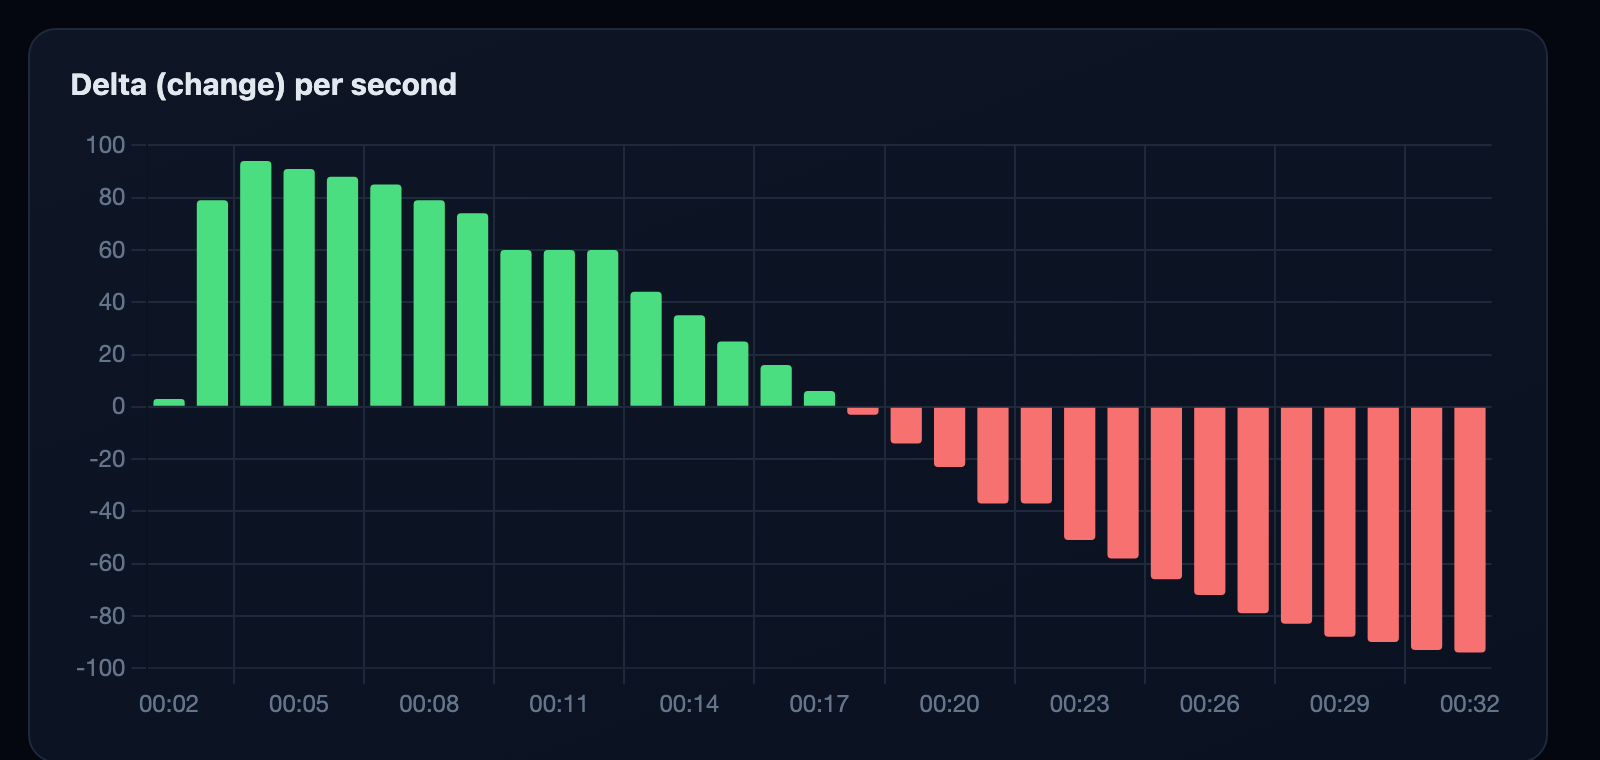
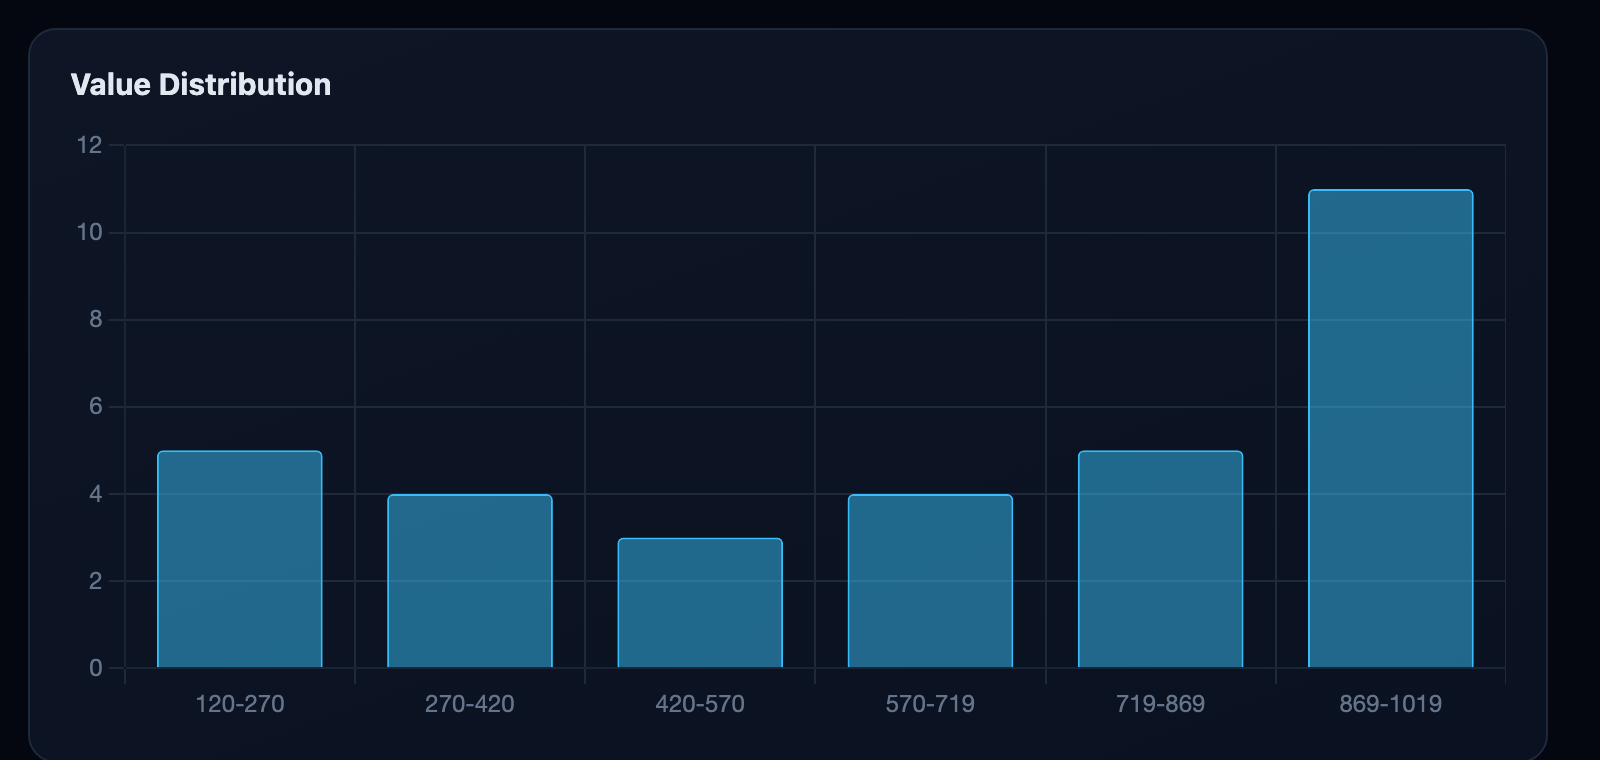
Moving Average — smoothed trend over the raw curve.Delta — green wash-in, red wash-out.Value Distribution — histogram of detected values.All charts are interactive: scroll to zoom, drag to pan, and set a custom time range on the main chart.
Step 6Export
Download your results in three formats for further analysis, publication, or archival.
CSV
Tabular data for Excel, R, or Python pandas.
JSON
Structured data for programmatic processing.
PDF Report
Styled report with dashboard and charts.
Transparency & Verification
Every value on the chart is traceable — so you always know which numbers are measured and which are reconstructed.
Point colours — value provenance
On the Time Evolution chart, each point is coloured by how its value was obtained, so reconstructed values never hide among the real ones.
Read directly by OCR — a real measurementInterpolated — estimated from neighbours (no number in that frame)Corrected — an OCR outlier replaced by the local median
Frame thumbnails — hover to verify
Enable Frame thumbnails in Step 2 (on by default) and hover any point on the chart: you'll see the exact cropped frame the value was read from, next to the value itself. If a point is marked Interpolated, its thumbnail shows a frame with no readable number — confirming the value was estimated, not measured. These previews live only in your browser's memory and are never written to disk.
Hovering an interpolated point: the value is shown, the warning explains it was reconstructed, and the real frame (here, blank) confirms why.
Privacy & Data
ParaGlow is designed with privacy first — your data never leaves your machine.
🔒
No Data Stored
Videos and frames are processed in a temporary directory that is automatically deleted as soon as the analysis completes. Nothing is saved to disk permanently.
🏠
Fully Local
All processing — video decoding, OCR, and data analysis — happens entirely on your machine. No cloud services, no external API calls, no telemetry.
Customization Options
Fine-tune the analysis to match your video setup and accuracy needs.
λ
OCR Engine
Choose from Apple Vision, EasyOCR, or Dual mode in the settings panel. Unavailable engines appear greyed out. Docker uses EasyOCR only.
⏲
Frame Interval
Set how often frames are captured — from 0.25s (4 fps, very detailed) to 30s (sparse sampling). Default is 1 frame per second.
▢
Region Selection
Draw a rectangle on the first frame to tell OCR exactly where to look. Tighter crop = faster processing and fewer false readings.
ƒ
Moving Average Window
Adjust the smoothing window from 3s to 30s in the results dashboard. Larger windows show cleaner trends; smaller windows preserve rapid changes.